Basic Diagramming II - Generate & Couplings
Explore auto-generate diagrams, balancing and how to couple vehicle diagrams.
Pre-requisites
- Download of the Diagramming Demo Timetable
- An active Diagramming licence for ATTUne
- Understanding of how to edit schedules in the ATTUne timings grid
Download the Diagramming Demo Timetable (.zip)
If importing to server connected ATTUne each user should add their initials to prevent overlapping timetables being created.
Open the timetable and filter trains
Open and filter the ‘Diagramming Demo Timetable’.
You can skip steps 1 and 2 if you already have the timetable open and go directly to the
Train Filterfrom the Trains & Stops window.
- Open ATTUne and select the timetable
- Open the timetable in
Validatedmode - Set the train filter
Clear Allto ensure none of the filters are active- Set the
Tagsfilter by clicking...and selecting ‘Milford-Bristol’
- The bottom left corner of the Train Filter should read ‘40 of 89 services match the filter’
- Press select to load the timetable with the active filter
If you cannot see
Tagson the train filter you may need to enable it.With the filter open select
More Filters...at the bottom of the filter window and clickTagto show the tag filter.

Open Diagramming
With the filter set so that 40 trains are visible, we can now open diagramming.
- Press
CTRL+D - In the main toolbar select
Rolling Stock>Open Diagramming
You can check the number of filtered trains in the info-bar at the bottom of the Trains and Stops window.
It is important that the trains are filtered, as re-generate will overwrite all diagrams if a filter is not set.

Quickly Generate Diagrams
With diagramming open and 40 trains filtered we can now automatically generate some basic diagrams…
- Select the
Gantttab in the diagramming window - In the main toolbar select
Re-generate - You will recieve a popup warning ‘Keep links for 40 filtered trains’. Select
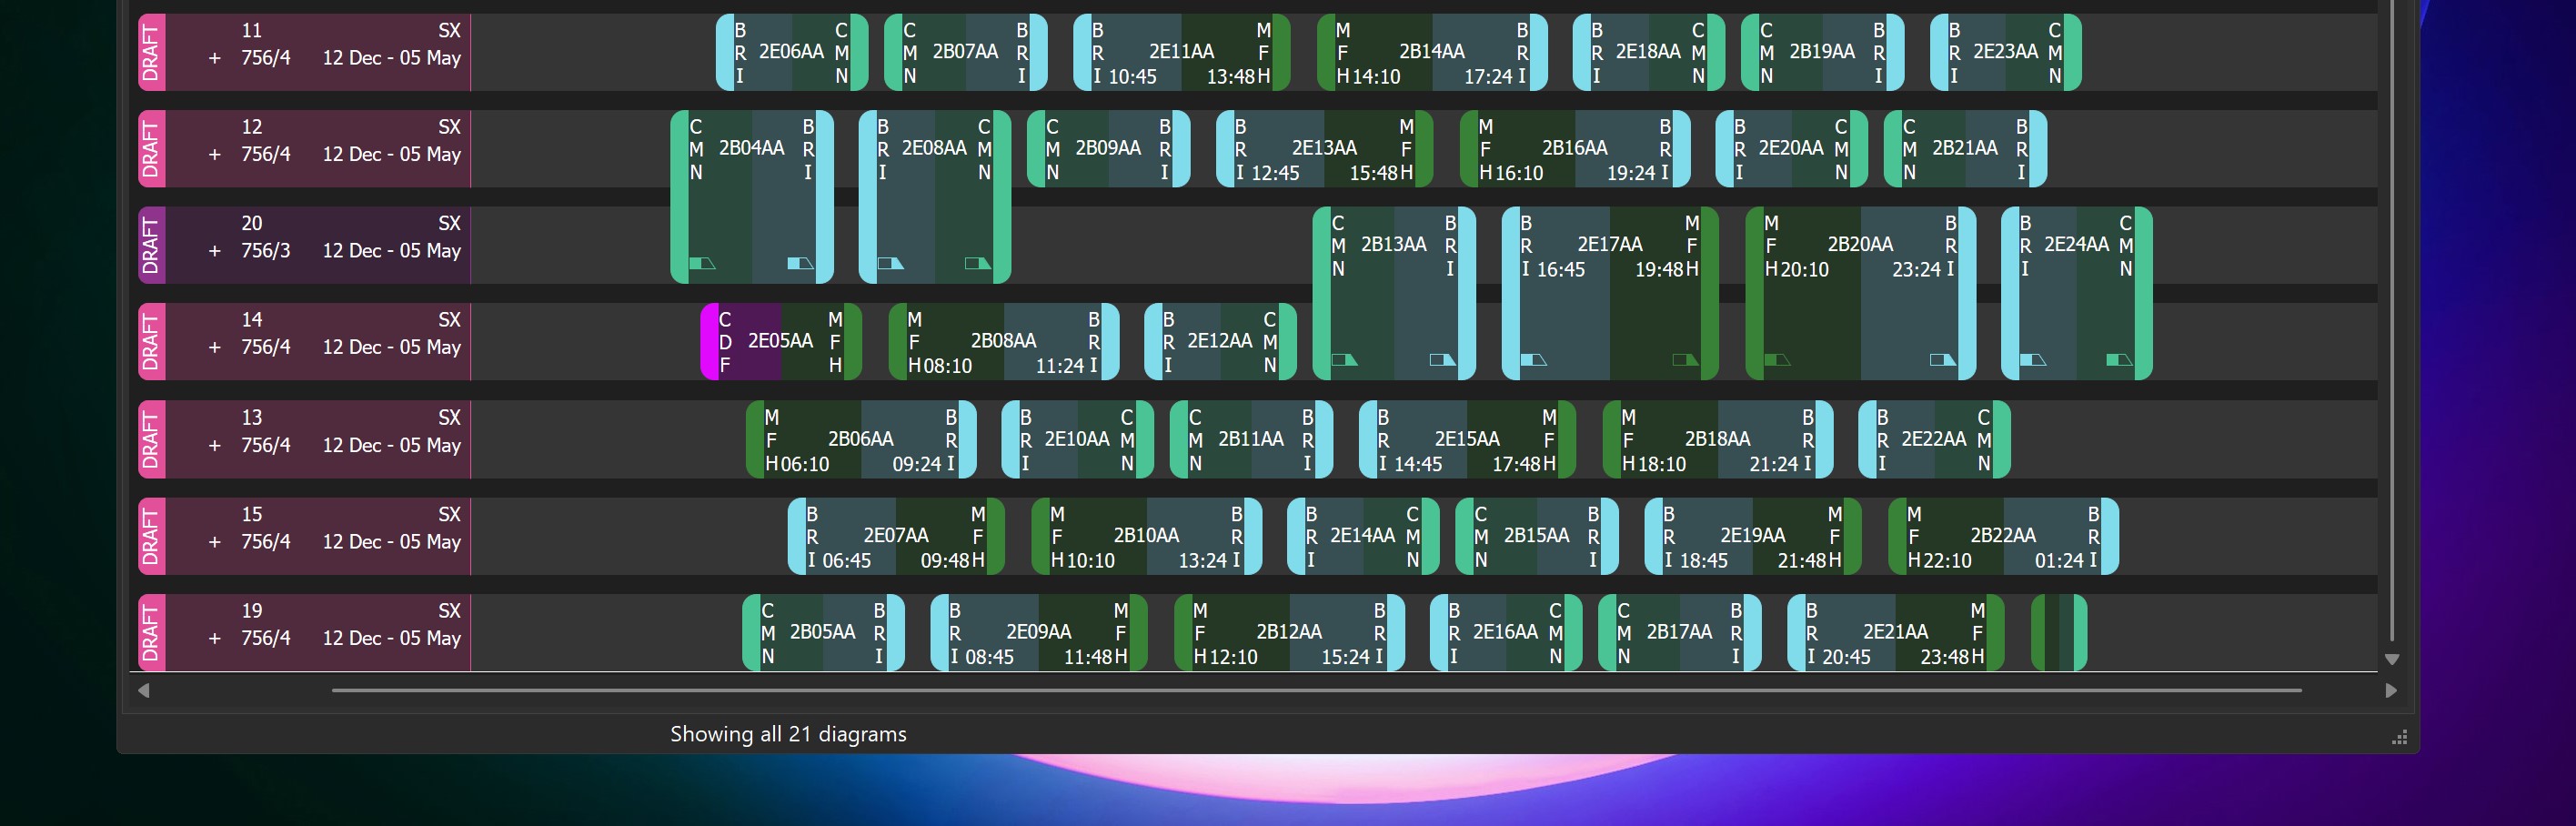
No - This should create 6 diagrams that look something like this…
- Note that the colours may be different

The diagramming window has it’s own train filter which can be customised. In the Diagramming Gantt toolbar select
View>Train FilterWhen you first open the diagramming window the train filter is copied from the Trains & Stops filter but does not remain in sync once the diagram window is open.
Platform Warnings
You should see a set of warning symbols on the schedules. This is because there are ‘Platform Mismatches’ between inbound and outbound workings at ‘Bristol Temple Meads’ and ‘Carmarthen’.
- Use your existing ATTUne knowledge to change:
- Trains departing ‘Bristol Temple Meads’ to use platform ‘1’ instead of ‘3’
- Trains terminating at ‘Carmarthen’ to use platform ‘2’ instead of ‘1’
- You should now see all of the warning symbols disappear
We assume you are familiar with how to edit schedules. Please revise our timing tutorials if you are not familiar with how to make platform changes.
Change Unit Types
We can change the unit types of these diagrams on the Diagram List tab. Firstly we need to select all 6 diagrams in the Gantt tab, and we can use the filter to help us.
- In the main toolbar select
Diagram Filter - Towards the bottom of the filter click
Defaults, then:- Check
Only Show Diagrams Matching the Train Filterand - Un-check
Always Show Orphan / Unallocated Diagrams
- Check

You should now have 6 filtered diagrams and we can now navigate to the Diagram List tab.
In the grid we can bulk-edit the Fleet Unit Type column by clicking and dragging in the desired cells (highlighted in blue below) and then typing.
In this instance we want to make sure that the value is ‘756/4’ and then press ENTER to confirm the value.
If your diagrams are already ‘756/4’ try changing to ‘807’ and pressing
ENTERfirst. Then change the value back to ‘756/4’.

Strengthening (coupling) units
If we navigate back to the Gantt tab we can look at attaching some additional vehicles to provide extra capacity at peak times.
- Ensure the
Gantttab is active - Find and select ‘2B04AA’ and ‘2E08AA’ on one of the diagrams
- Use
CTRLclick to select both legs - Also you can use the end tabs on each leg (the brightly coloured sections) as brackets which will select all legs to the beginning or end of the diagram.
- Use
- Right click on one of the selected legs and click
Strengthen>2 Selected Legs - Continue with the recommended dates by selecting
OK- This should be from
12/12/2022to05/05/2023 - Monday - Friday (SX)
- This should be from
- Change the diagram to a ‘756/3’
- Right click on the diagram label and select
Edit Diagram - Change
Unit Typeto ‘756/3’
- Right click on the diagram label and select
You can see unit type more clearly by changing your view settings. In the main toolbar select
View>Colour Units by Unit Type

This has created an extra diagram which - currently - only works 2 legs from ‘Carmarthen’ to ‘Bristol’ and back. But we can add some more work to this diagram for the evening peak…
- On schedule ‘2B13AA’,
CTRLclick where the yellow marker indicates on the above image and drag the legs onto the new diagram.
Hovering over the end tabs will highlight the selection you are about to make.
CTRLclicking and dragging will ‘strengthen’ a schedule rather than moving work from one diagram to another.

The end result will be a diagram which attaches and detaches at ‘Carmarthen’ and looks like this…
Splitting coupled diagrams mid-leg
We can attach and detach units in the middle of a schedule.
- Right click on the leg for ‘2B06AA’ and select
Strengthen>All legs from here - Right click on ‘2B18AA’ and select
Insert Midpoint- You can also select ‘2B18AA’ and press
CTRL+M
- You can also select ‘2B18AA’ and press
- Select ‘Cardiff Central’ as the location for your midpoint
- Select two legs from Cardiff to be deleted
- ‘2B18AA’ - ONLY the ‘Cardiff’ to ‘Bristol’ leg on ONLY 1 of the diagrams
- Press
CTRLand select2E22AAon the same diagram
- Delete the two selected legs
- Press
CTRL+DEL - Right click and select
Delete 2 Legs
- Press
- Finally, change the diagram which now finishes at ‘Cardiff Central’ to be a ‘756/3’ using the method we covered earlier.

ATTUne has automatically calculated the position of each diagram based on the geography model. The small symbols on the gantt view show the position each diagram is in at the start and end of each leg.
